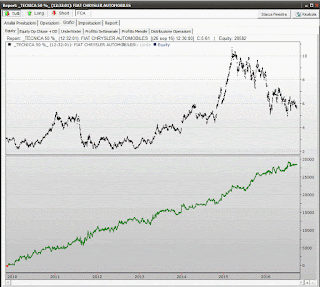
allora..come dicevo non esiste un indicatore che sviluppi segnali utili nel tempo ( quelle che vogliono " vendervi " come divergenze non sono altro che la certificazione dell'errore dello stesso )...perciò bisogna trovare un comportamento ripetitivo dell'azione che si possa sfruttare
nel caso di fiat ( ed ogni azione è un mondo a se )..essendo uno dei titoli più speculativi del mercato italiano ..possiamo notare che mensilmente ha un range medio intorno al 19/20%..praticamente la percentuale tra i massimi ed i minimi generati
e perciò ci ho costruito il ts che metto sotto..poi spiego ogni stringa
//______________________________________Tecnica Apertura Mese Fiat___________________________//
Var: Pr_Ingr(0), Max_Gain(0), Max_Gain_perc(0), actual(0); ///_____Actual=Gain
Var: fflat,lg,sh,contalg,contash,contaflat; // monitoraggio situazione flat / long / short
var: percentom,percentomHL,indzona1,indzona2;
var: meseprec,max_percentom, min_percentom;
var: meseprec9,cambiatogiorno,contagiornoinessere,prova,prox01,prox02;
Var: idlastop,contagain,ivp2,filtrocontagain,meseprec8,vp1;
//////////////////////___CONTA_Situazione___///////////////////////////////////////////////
if positiondir=0 then fflat=1;endif; if positiondir<>0 then fflat=0;contaflat=0;endif; if fflat=1 and fflat[1]=1 then contaflat=(contaflat[1]+1);endif;
if positiondir=1 then lg=1;endif; if positiondir<>1 then lg=0;contalg=0;endif; if lg=1 and lg[1]=1 then contalg=(contalg[1]+1);endif;
if positiondir=-1 then sh=1;endif; if positiondir<>-1 then sh=0;contash=0;endif; if sh=1 and sh[1]=1 then contash=(contash[1]+1);endif;
/////////////////////////////////// ACTUAL /////////////////////////////////////////////////////
if Positionvalue<>0 then Pr_Ingr = positionValue;
if Positiondir=1 then if (C>Max_Gain) or (Max_Gain=0) then Max_Gain = C;
Max_Gain_perc = ((Max_Gain-Pr_ingr)*100)/Pr_Ingr;endif;
Actual = ((C-Pr_ingr)*100)/Pr_Ingr;
else
if (C<Max_Gain) or (Max_Gain=0) then Max_Gain = C;
Max_Gain_perc = ((Pr_ingr-Max_Gain)*100)/Pr_Ingr;endif;
Actual = ((Pr_ingr-C)*100)/Pr_Ingr;endif;
else Pr_ingr = 0;Max_Gain = 0; Actual = 0;endif;
/////////////////////////////////////////////////////////////////////////////
cambiatogiorno = GetValues(days, 1, prova, prova, prova, prova);
if getmonth<>meseprec9 then contagiornoinessere=0;endif;
if cambiatogiorno then contagiornoinessere=contagiornoinessere+1;endif;
meseprec9=getmonth;
////////////////////////////////////////////////////////////////////////////////////////////////
percentom=abs(((openm-c)/openm)*100);
percentomHL=abs(((HIGHM-LOWM)/highm)*100);
if c<openm then percentom=-1*percentom;endif;
prox01=addperc(openm,3);
prox02=addperc(openm,-3);
PlotChart(openM,0, yellow, solid, 1);
PlotChart(prox01,0, white, dot, 1);
PlotChart(prox02,0, red, dot, 1);
DrawText(NEWOGG,0 ,D ,openm , " openmese =",openm , white, 10, 2+3,Alright);
DrawText(NEWOGG,0 ,D ,prox01 , "trigger long openmese+3%=",prox01 , white, 10, 1+4,Alright);
DrawText(NEWOGG,0 ,D ,prox02 , "trigger short openmese-3%=",prox02 , white, 10, 1+4,Alright);
installstoploss(inperc,3.00,"SL", STARTNEXTBAR);
plotchartNoZero(getstoploss, 0, red, solid, 2);
DrawText(NEWOGG,0 , D,getstoploss , "sl",getstoploss , black, 25, 1+4,Alright);
if c>prox01 and contagain<4 and contagiornoinessere<19 and contaflat>1 then enterlong(nextbar,atopen);endif;
if positiondir=1 and contagiornoinessere>18 then exitlong(nextbar,atopen);endif;
if positiondir=1 and actual>7 then exitlong(nextbar,atopen);endif;
if c<prox02 and contagain<4 and contagiornoinessere<19 and contaflat>1 then entershort(nextbar,atopen);endif;
if positiondir=-1 and contagiornoinessere>18 then exitshort(nextbar,atopen);endif;
if positiondir=-1 and actual>7 then exitshort(nextbar,atopen);endif;
if getMonth <> meseprec8 then
contagain = 0;
endif;
if IdLastOpClosed > idlastop then
contagain = contagain + LastTradeClosedPerc;
endif;
idlastop = IdLastOpClosed;
ivp2 = Createviewport(300);
plotchart(contagain, ivp2, COLUPDOWNZERO);
meseprec8=getmonth;
indzona1 = Createviewport(300);
PlotChart(Percentom,indzona1,white,solid,2);
PlotChart(PercentomHL,indzona1,red,solid,2);
plotchart(-0.0000000001,indzona1,yellow,dot,1);
DrawText(NEWOGG,indzona1 , D,percentom , "% distanza open mese",percentom , red, 10, 1+4,Alright);
vp1 = Createviewport(150);
Plotchart(max_gain_perc,vp1,red,solid,1);
Plotchart(actual,vp1,blue,solid,2);
indzona2=CreateViewport(100, 0, true);
plotchart(contagiornoinessere, indzona2,green, solid, 1 );
DrawText(NEWOGG,indzona2 ,D ,contagiornoinessere , "giorni borsistici=",contagiornoinessere , white, 15, 1+2,Alright);


