x utente sotto
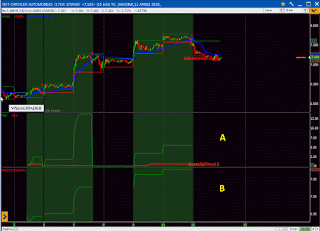
nel grafico sotto ..in area A..mgv=massimo gain virtuale..sarebbe il run up di ogni operazione...mlv=massimo loss virtuale..sarebbe il drawdown..espressi in percentuale
in area B...prezzomassimo..sarebbe il massimo prezzo toccato di ogni operazione long
se l'operazione si svolge in un solo giorno il prezzomassimo coincidira con il massimo del giorno..se l'operazione dura più giorni il prezzomassimo è molto probabile che coincidira con il massimo dell'ultimo giorno
Var:wmax,wmin,wmed,vp1,vp2,vp3,vp4;
Var:miavar(0),MioSUPERTREND0,maxLastLong,maxGainVirtuale,maxLossVirtuale,MGV,MLV,prezzomassimo;
if isfirstbarday then
WMAX=H;
WMIN=L;
else
WMAX=iif(H>=WMAX[1],H,WMAX[1]);
WMIN=iif(L<=WMIN[1],L,WMIN[1]);
WMED=wmax-(wmax-wmin)*0.5;
endif;
PlotChart(WMAX,0, green, dot, 1);
PlotChart(WMIN,0, red, dot, 1);
xGainVirtuale=(((H-positionvalue)/positionvalue)*100);
maxLossVirtuale=(((positionvalue-L)/positionvalue)*100);
if (maxGainVirtuale>MGV)then MGV=maxGainVirtuale;endif;
//endif;
if (maxLossVirtuale>MLV)then MLV=maxLossVirtuale;endif;
if positiondir=0 then MGV=0;endif;
if positiondir=0 then MLV=0;endif;
if positiondir=1 then maxLastLong=Wmax;endif;
/////////////////////////////////////////////////////////////////////////////////////
if positiondir=1 and h>prezzomassimo then prezzomassimo=h;endif;
if positiondir=0 then prezzomassimo=0;endif;
MioSUPERTREND0 = SUPERTREND(C, 10, 3);
PlotChart(MioSUPERTREND0, 0, BLUE, solid, 3);
if C > MioSUPERTREND0 then EnterLong(NextBar, AtOpen); endif;
if C < MioSUPERTREND0 then ExitLong(NextBar, AtOpen); endif;
{vp1 = Createviewport(550);
Plotchart(maxLastLong,VP1,GREEN,solid,2);
DrawText(1,vp1 ,D ,maxLastLong , "maxUltimoLong",maxLastLong , red, 10, 2+3,Alleft);
vp2 = Createviewport(550);
Plotchart(maxGainVirtuale,VP2,GREEN,solid,2);
Plotchart(maxLossVirtuale,VP2,RED,solid,2); }
vp3 = Createviewport(550);
Plotchart(MGV,VP3,GREEN,solid,2);
Plotchart(MLV,VP3,RED,solid,2);
DrawText(4,vp3 ,D ,mgv , "%maxLgVirtual",mgv , green, 10, 2+3,Alleft);
DrawText(5,vp3 ,D ,mlv , "%maxShVirtual",mlv , red, 10, 2+3,Alleft);
vp4 = Createviewport(550);
PlotchartnoZero(prezzomassimo,VP4,GREEN,solid,2);
DrawText(6,vp4 ,D ,prezzomassimo , "prezzoMaxLong",prezzomassimo , green, 10, 2+3,Alleft);DrawText(2,0 ,D ,wmax , "max.intraday=",wmax , green, 10, 2+3,Alleft);
DrawText(3,0 ,D ,wmin , "min.intraday=",wmin , red, 10, 2+3,Alleft);
/////////////////////////////////////////////////////////////////////////////////


Buongiorno Xavier, era proprio quello che cercavo, anzi ci sono più informazioni di quelle richieste. Tutti spunti molto utili ed interessanti per il trading. Ti ringrazio ancora e continuerò a seguirti con interesse sul blog, a presto.
ResponderEliminarottimo..magari dimmi il tuo nome ..va bene anche uno di fantasia..per avere un riferimento
ResponderEliminarCerto! Mi chiamo Bruno come te.
ResponderEliminar