miércoles, 15 de abril de 2020
x utente sotto
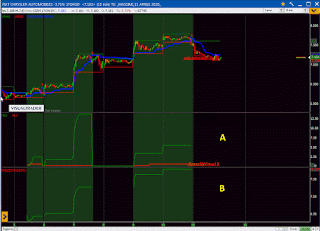
nel grafico sotto ..in area A..mgv=massimo gain virtuale..sarebbe il run up di ogni operazione...mlv=massimo loss virtuale..sarebbe il drawdown..espressi in percentuale
in area B...prezzomassimo..sarebbe il massimo prezzo toccato di ogni operazione long
se l'operazione si svolge in un solo giorno il prezzomassimo coincidira con il massimo del giorno..se l'operazione dura più giorni il prezzomassimo è molto probabile che coincidira con il massimo dell'ultimo giorno
Var:wmax,wmin,wmed,vp1,vp2,vp3,vp4;
Var:miavar(0),MioSUPERTREND0,maxLastLong,maxGainVirtuale,maxLossVirtuale,MGV,MLV,prezzomassimo;
if isfirstbarday then
WMAX=H;
WMIN=L;
else
WMAX=iif(H>=WMAX[1],H,WMAX[1]);
WMIN=iif(L<=WMIN[1],L,WMIN[1]);
WMED=wmax-(wmax-wmin)*0.5;
endif;
PlotChart(WMAX,0, green, dot, 1);
PlotChart(WMIN,0, red, dot, 1);
xGainVirtuale=(((H-positionvalue)/positionvalue)*100);
maxLossVirtuale=(((positionvalue-L)/positionvalue)*100);
if (maxGainVirtuale>MGV)then MGV=maxGainVirtuale;endif;
//endif;
if (maxLossVirtuale>MLV)then MLV=maxLossVirtuale;endif;
if positiondir=0 then MGV=0;endif;
if positiondir=0 then MLV=0;endif;
if positiondir=1 then maxLastLong=Wmax;endif;
/////////////////////////////////////////////////////////////////////////////////////
if positiondir=1 and h>prezzomassimo then prezzomassimo=h;endif;
if positiondir=0 then prezzomassimo=0;endif;
MioSUPERTREND0 = SUPERTREND(C, 10, 3);
PlotChart(MioSUPERTREND0, 0, BLUE, solid, 3);
if C > MioSUPERTREND0 then EnterLong(NextBar, AtOpen); endif;
if C < MioSUPERTREND0 then ExitLong(NextBar, AtOpen); endif;
{vp1 = Createviewport(550);
Plotchart(maxLastLong,VP1,GREEN,solid,2);
DrawText(1,vp1 ,D ,maxLastLong , "maxUltimoLong",maxLastLong , red, 10, 2+3,Alleft);
vp2 = Createviewport(550);
Plotchart(maxGainVirtuale,VP2,GREEN,solid,2);
Plotchart(maxLossVirtuale,VP2,RED,solid,2); }
vp3 = Createviewport(550);
Plotchart(MGV,VP3,GREEN,solid,2);
Plotchart(MLV,VP3,RED,solid,2);
DrawText(4,vp3 ,D ,mgv , "%maxLgVirtual",mgv , green, 10, 2+3,Alleft);
DrawText(5,vp3 ,D ,mlv , "%maxShVirtual",mlv , red, 10, 2+3,Alleft);
vp4 = Createviewport(550);
PlotchartnoZero(prezzomassimo,VP4,GREEN,solid,2);
DrawText(6,vp4 ,D ,prezzomassimo , "prezzoMaxLong",prezzomassimo , green, 10, 2+3,Alleft);DrawText(2,0 ,D ,wmax , "max.intraday=",wmax , green, 10, 2+3,Alleft);
DrawText(3,0 ,D ,wmin , "min.intraday=",wmin , red, 10, 2+3,Alleft);
/////////////////////////////////////////////////////////////////////////////////
martes, 14 de abril de 2020
MGV= massimo gain virtuale
MLV= massimo loss virtuale
Var: wmax,wmin,wmed,vp1,vp2,vp3;
Var: miavar(0),MioSUPERTREND0,maxLastLong,maxGainVirtuale,maxLossVirtuale,MGV,MLV;
if isfirstbarday then
WMAX=H;
WMIN=L;
else
WMAX=iif(H>=WMAX[1],H,WMAX[1]);
WMIN=iif(L<=WMIN[1],L,WMIN[1]);
WMED=wmax-(wmax-wmin)*0.5;
endif;
PlotChart(WMAX,0, green, dot, 1);
PlotChart(WMIN,0, red, dot, 1);
DrawText(2,0 ,D ,wmax , "max.intraday=",wmax , green, 10, 2+3,Alleft);
DrawText(3,0 ,D ,wmin , "min.intraday=",wmin , red, 10, 2+3,Alleft);
/////////////////////////////////////////////////////////////////////////////////
maxGainVirtuale=(((H-positionvalue)/positionvalue)*100);
maxLossVirtuale=(((positionvalue-L)/positionvalue)*100);
if (maxGainVirtuale>MGV)then MGV=maxGainVirtuale;endif;
//endif;
if (maxLossVirtuale>MLV)then MLV=maxLossVirtuale;endif;
if positiondir=0 then MGV=0;endif;
if positiondir=0 then MLV=0;endif;
if positiondir=1 then maxLastLong=Wmax;endif;
MioSUPERTREND0 = SUPERTREND(C, 10, 3);
PlotChart(MioSUPERTREND0, 0, BLUE, solid, 3);
if C > MioSUPERTREND0 then EnterLong(NextBar, AtOpen); endif;
if C < MioSUPERTREND0 then ExitLong(NextBar, AtOpen); endif;
{vp1 = Createviewport(550);
Plotchart(maxLastLong,VP1,GREEN,solid,2);
DrawText(1,vp1 ,D ,maxLastLong , "maxUltimoLong",maxLastLong , red, 10, 2+3,Alleft);
vp2 = Createviewport(550);
Plotchart(maxGainVirtuale,VP2,GREEN,solid,2);
Plotchart(maxLossVirtuale,VP2,RED,solid,2); }
vp3 = Createviewport(550);
Plotchart(MGV,VP3,GREEN,solid,2);
Plotchart(MLV,VP3,RED,solid,2);
DrawText(4,vp3 ,D ,mgv , "%maxGainVirtual",mgv , green, 10, 2+3,Alleft);
DrawText(5,vp3 ,D ,mlv , "%maxLossVirtual",mlv , red, 10, 2+3,Alleft);
sábado, 11 de abril de 2020
x utente sotto..ciao
ti metto codice ts..estrae e tiene in memoria i massimi di ogni operazione long
alla riga 21 se togli i due // ti azzera totalmente il valore( schiaccia un pò il grafico)
[code]
Var: wmax,wmin,wmed,vp1,vp2;
Var: miavar(0),MioSUPERTREND0,maxLastLong;
if isfirstbarday then
WMAX=H;
WMIN=L;
else
WMAX=iif(H>=WMAX[1],H,WMAX[1]);
WMIN=iif(L<=WMIN[1],L,WMIN[1]);
WMED=wmax-(wmax-wmin)*0.5;
endif;
PlotChart(WMAX,0, green, dot, 1);
PlotChart(WMIN,0, red, dot, 1);
DrawText(2,0 ,D ,wmax , "max.intraday=",wmax , green, 10, 2+3,Alleft);
DrawText(3,0 ,D ,wmin , "min.intraday=",wmin , red, 10, 2+3,Alleft);
/////////////////////////////////////////////////////////////////////////////////
if positiondir=1 then maxLastLong=Wmax;endif;
//if positiondir=0 then maxLastLong=0;endif;
MioSUPERTREND0 = SUPERTREND(C, 10, 3);
PlotChart(MioSUPERTREND0, 0, BLUE, solid, 3);
if C > MioSUPERTREND0 then EnterLong(NextBar, AtOpen); endif;
if C < MioSUPERTREND0 then ExitLong(NextBar, AtOpen); endif;
vp1 = Createviewport(550);
Plotchart(maxLastLong,VP1,GREEN,solid,2);
DrawText(1,vp1 ,D ,maxLastLong , "maxUltimoLong",maxLastLong , red, 10, 2+3,Alleft);
[/code]
jueves, 9 de abril de 2020
x utente sotto...
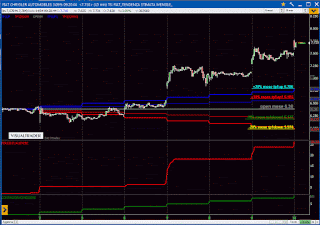
ciao..si può ricavare il massimo battuto quando il sistema è long..nel ts vi è anche la rilevazione della percentuale massima virtuale...max_gain_perc
nel grafico sotto si vede come stamane con la candela delle 0930 il sistema abbia calcolato la resa massima dell'operazione in corso..lo fa sempre a chiusura candela
ti va bene il max_gain_perc o vuoi i massimi assoluti?
per una corretta lettura dei risultati dei ts ho inserito il divieto di short dei 3 mesi nei sistemi
la stringa di uscita dalle posizioni ribassiste ed il filtro di no entrata sh per i 3 mesi successivi
Var: condizCovid19,noshCovid19;
if (GetYear = 2020) and (GetDay >= 18) and (GetMonth = 03) then condizCovid19=1;else condizCovid19=0;endif;
if condizCovid19<>condizCovid19[1] then noshCovid19=noshCovid19+1;endif;
if (GetYear = 2020) and (GetDay >= 18) and (GetMonth = 06) then noshCovid19=0;endif;
if positiondir=-1 and condizCovid19<>0 then exitshort(nextbar,atopen,STOP, 0,"Exit Short 6");endif;
......and noshCovid19=0 then entershort(nextbar,atopen);endif;
miércoles, 1 de abril de 2020
situazione grafica su Fiat
nuovo mese in partenza..Aprile 2020..apertura 6.38€ (marzo 2020 aveva aperto a 11.38€)
fase di debolezza con quotazioni all'interno della scorsa ottava..operativita short vietata
operativita long consigliata di breve respiro con pochi pezzi
prezzi sotto i 50% della settimana precedente indicano sempre scarsa forza rialzista
Suscribirse a:
Comentarios (Atom)
giornataccia venerdi 6 febbraio 2026 x Stellantis + 10 volte la media i volumi sul ribasso..impulsiva down ed i target sono molto sotto sop...

-
un caro collega mi fa presente che l'impulsiva down del 17 settembre potrebbe essere differente come valori da quelli postati sulla can...
-
ora è presente sul giornaliero un impulso ribassista...quello del 17 settembre..supportato da un aumento volumetrico di circa 7 volte la me...
-
han fatto un altra scaricata accompagnata da volumi mi raccomando...sotto il 50% di giovedi scorso il long è molto rischioso


