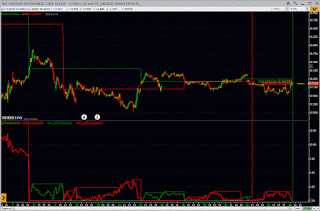
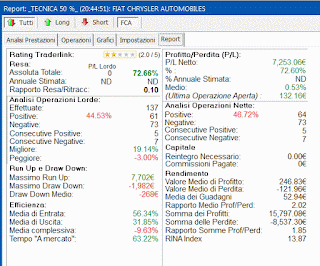
vi metto la resa da gennaio 2017 su Fiat col ts 50% iniziale
in partenza il ts aveva solo un exit long ed uno short e rimaneva di + a mercato
poi lo abbiamo migliorato sopratutto per la parte short e e per il tempo di esposizione a mercato
comunque come potete costatare a livello di resa % il risultato non è molto diverso da quello attuale
//__________________________________________Tecnica 50%________________________//
Var: newday(false), mioopen(0), miomin(0), miomax(0), mioclose(0),dvsup,dvmed,dvinf;
Var: wmax,wmin,wmed,DMAX,DMIN,rrange,vp1,vp2;
//Var: lin1(0);
newday=GetValues(days,1,mioopen,miomin,miomax,mioclose);
dvsup= miomin+(261.8*(miomax-miomin))/100;
dvmed= miomin+(50*(miomax-miomin))/100;
dvinf= miomax-(261.8*(miomax-miomin))/100;
if isfirstbarday then
WMAX=H;
WMIN=L;
else
WMAX=iif(H>=WMAX[1],H,WMAX[1]);
WMIN=iif(L<=WMIN[1],L,WMIN[1]);
WMED=wmax-(wmax-wmin)*0.5;
endif;
rrange=(((highd(1)-lowd(1))/lowd(1))*100);
PlotChart(WMED,0, gray, dot, 1);
DrawText(NEWOGG,0 , D,wmed , "50% intraday",wmed , red, 12, 2+2,Alleft);
DrawText(NEWOGG,0 , D,dvmed , "50% ieri",dvmed , white, 14, 3+2,Alleft);
//if t>1500 then plotchartNoZero(wmed, 0, 0, solid, 2);endif;
////////////////////////////////////////////////////////////////////////////////////////////////
installstoploss(inperc,3.00,"SL", STARTNEXTBAR);
plotchartNoZero(getstoploss, 0, red, solid, 2);
DrawText(NEWOGG,0 , D,getstoploss , "sl",getstoploss , red, 25, 1+4,Alleft);
///////////////////////////////////////////////////////////////////////////////////////////////////
if positiondir=0 and c<dvsup and c>highd(1) and GetNumOpEnterLongToday=0 then enterlong( nextbar,atopen);endif;
if positiondir=1 and c<dvmed then exitlong(nextbar,atopen);endif;
//if positiondir=1 and t=1700 and c<wmed then exitlong(nextbar,atopen);endif;
if positiondir=0 and c>dvinf and c<lowd(1) and GetNumOpEntershortToday=0 then entershort( nextbar,atopen);endif;
if positiondir=-1 and c>dvmed then exitshort(nextbar,atopen);endif;
//if positiondir=-1 and t=1700 and c>wmed then exitshort(nextbar,atopen);endif;
if positiondir=1 then
colorbar(fuchsia);
DrawText(NEWOGG, 0, D, H, "exit long se close a 15 minuti < al 50% di ieri = ", dvmed, white, 14,FSUnderline , Alright);
endif;
if positiondir=-1 then
colorbar(gray);
DrawText(NEWOGG, 0, D, H, "exit short se close a 15 minuti > al 50% di ieri = ", dvmed, white, 14,FSUnderline , Alright);
endif;
plotchart(dvsup,0,green,dot,1);
plotchart(dvmed,0,blue,solid,1);
plotchart(dvinf,0,red,dot,1);
vp1 = Createviewport(150);
Plotchart(rrange,vp1,red,solid,1);
DrawText(NEWOGG,vp1, D,rrange, "range % di ieri",rrange , red, 12, 2+3,Alright);
//DrawHLine (NEWOGG, vp1, 2.5, red, 1, 0);
{vp2 = Createviewport(150);
Plotchart(highd(1),vp2,green,solid,2); }


